When you want to make a trade on the NBX platform, you can head to the “Markets” page in the menu.
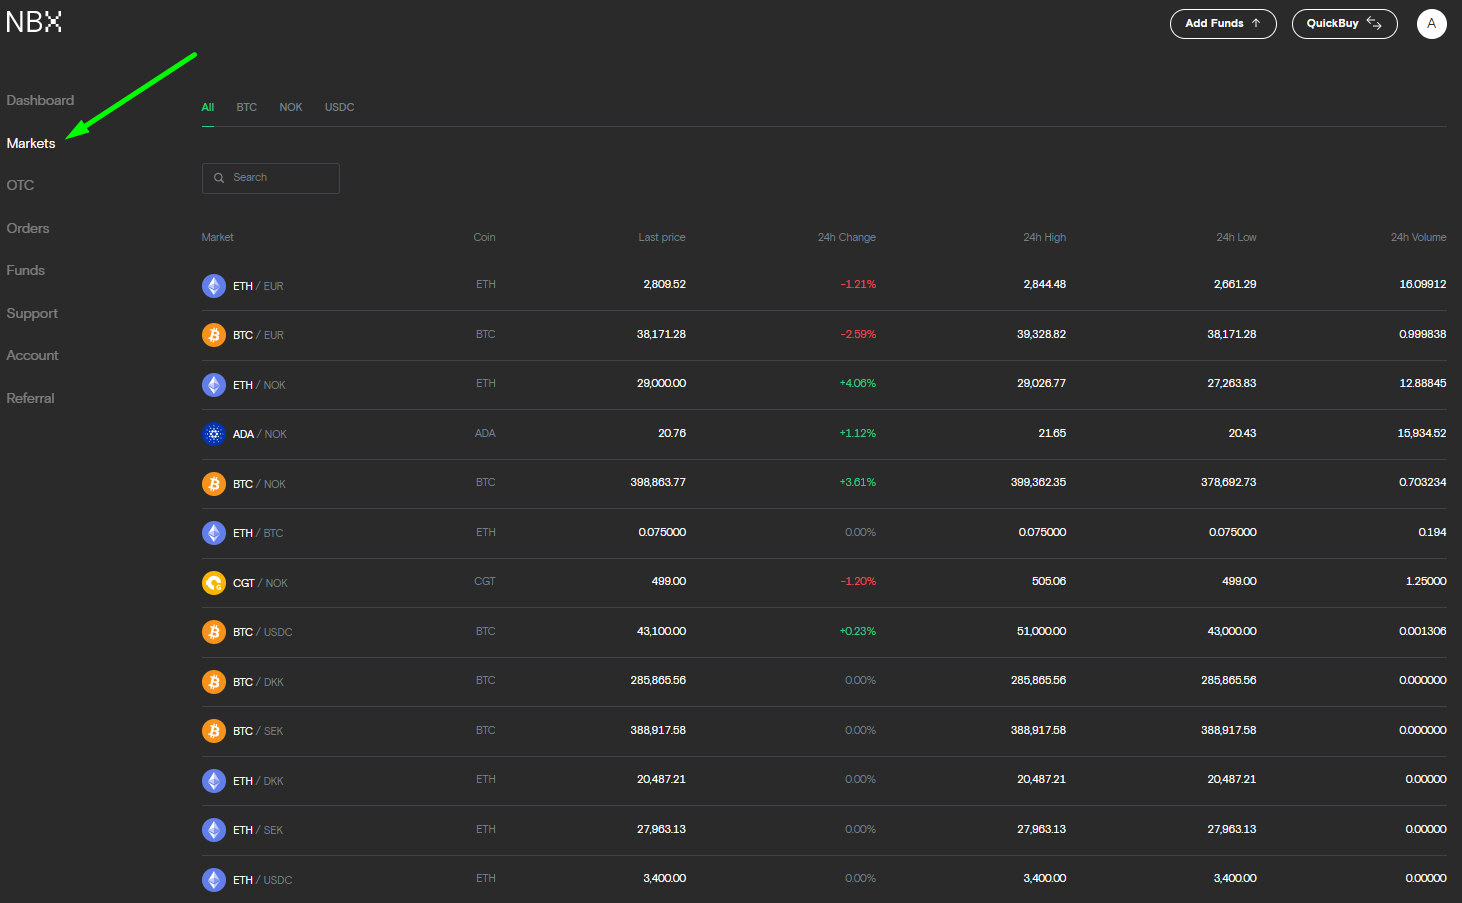
From there, you’ll choose the asset you’re interested in trading, like Bitcoin, which is most easily accessed via the BTC/NOK trading pair. At that point, you’ll see the screen below.
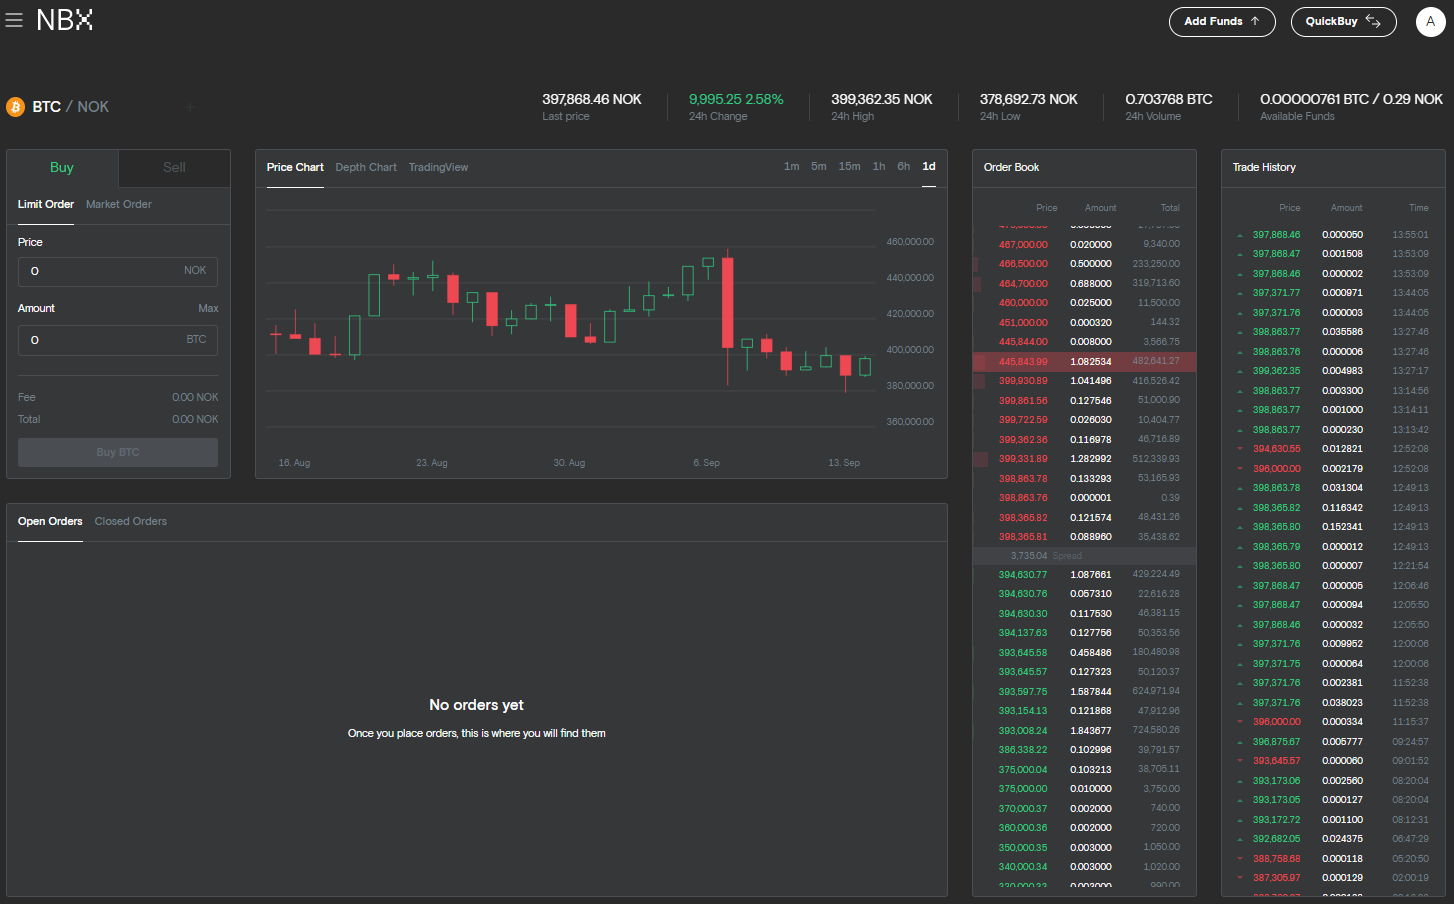
Identically to the “Markets” tab, your chosen market’s last price, 24-hour change, 24-hour high and low, and volume are all listed, except this time, along the top of your screen as above.
Buy and Sell
Below these measures, and to the left, you’ll see the option to buy or sell the market you’ve choosen.
 It’s there that you can make any trade you're interested in, as long as it’s either a limit order or a market order. A limit order wholly depends on a preset price that you set, while a market order is made at the current market price of an asset.
Making Informed Decisions
In the middle of the trading interface, you’ll see three tabs labeled “Price Chart,” “Depth Chart,” and “TradingView.” Generally, all three of these are tools to help you make more informed decisions on trades you’re interested in making before you make them.
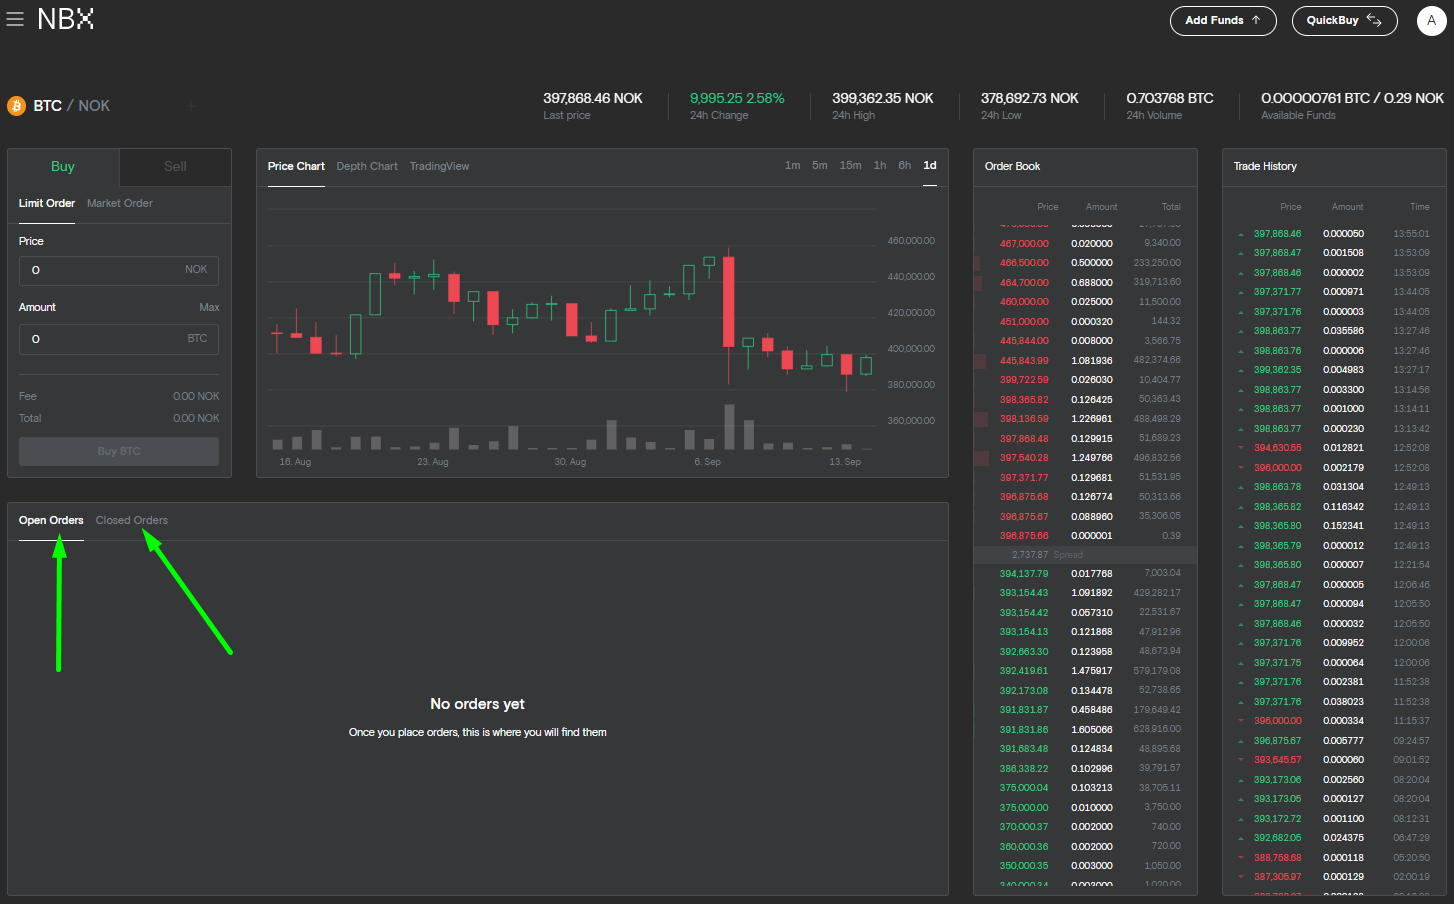
For example, if you click on Price Chart, you’ll see a graph of an asset’s price movements over the course of 1 day, 6 hours, 1 hour, 15 minutes, 5 minutes, or even a minute-by-minute basis, depending on what you’re interested in seeing. If you’re familiar with the field of technical analysis, then you’ll be able to break the chart down into well-known patterns to attempt to time when a bull or bear market is likely on the horizon. Keep in mind however that as with any trading tool, technical analysis is not at all an exact science and can’t be counted on alone.

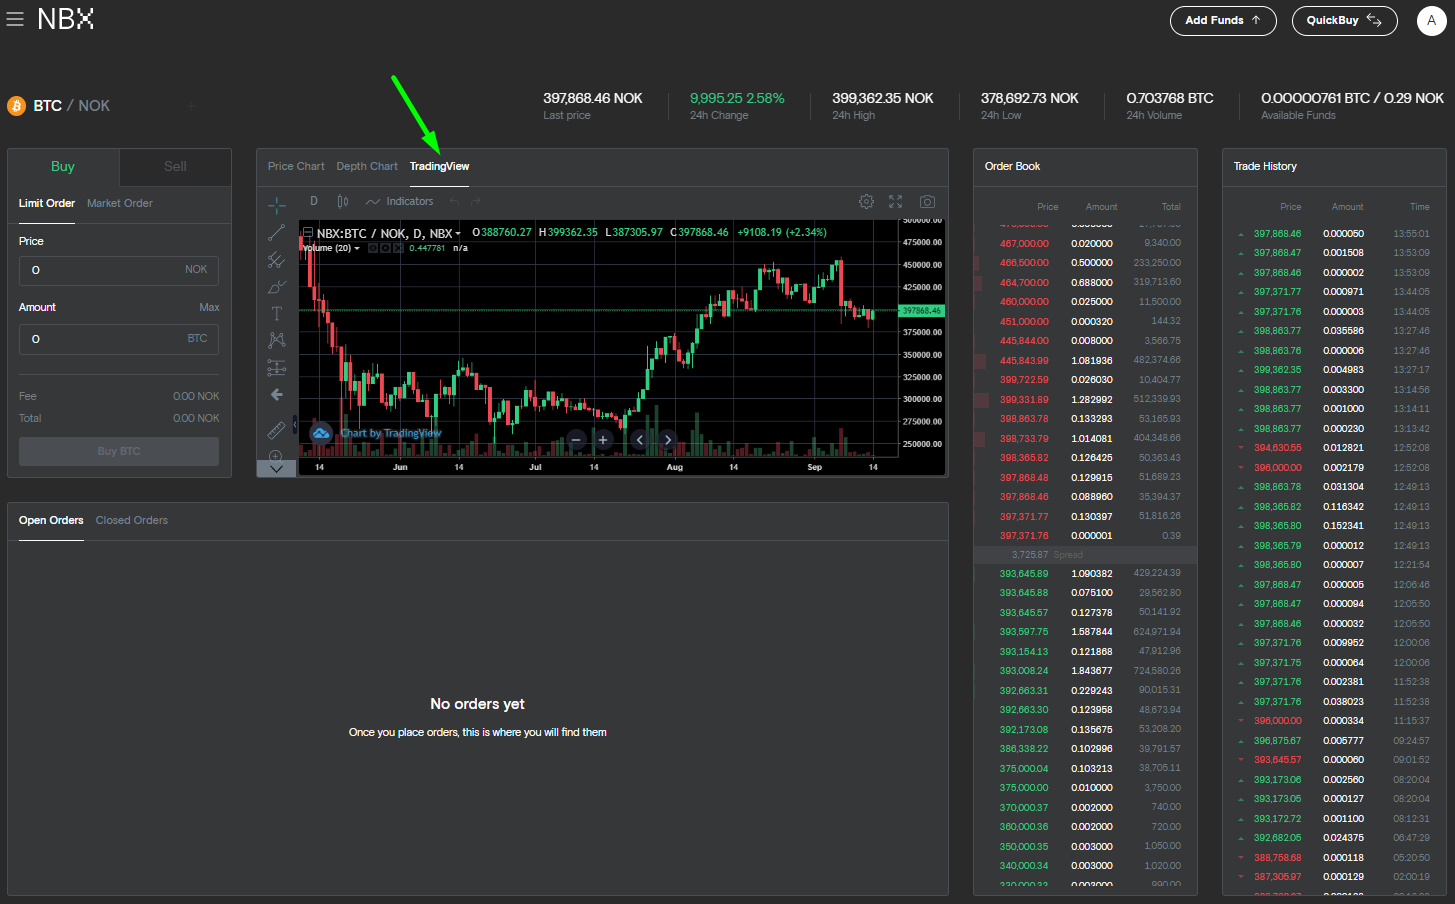
Similarly to the Price Chart, the TradingView tab shows a candlestick chart of your chosen asset’s activity. Here you can add trendlines and other indicators.
Last but not least, there’s the Depth Chart tool which gives you a window into the volume of an asset’s price movements related to both buys and sells.
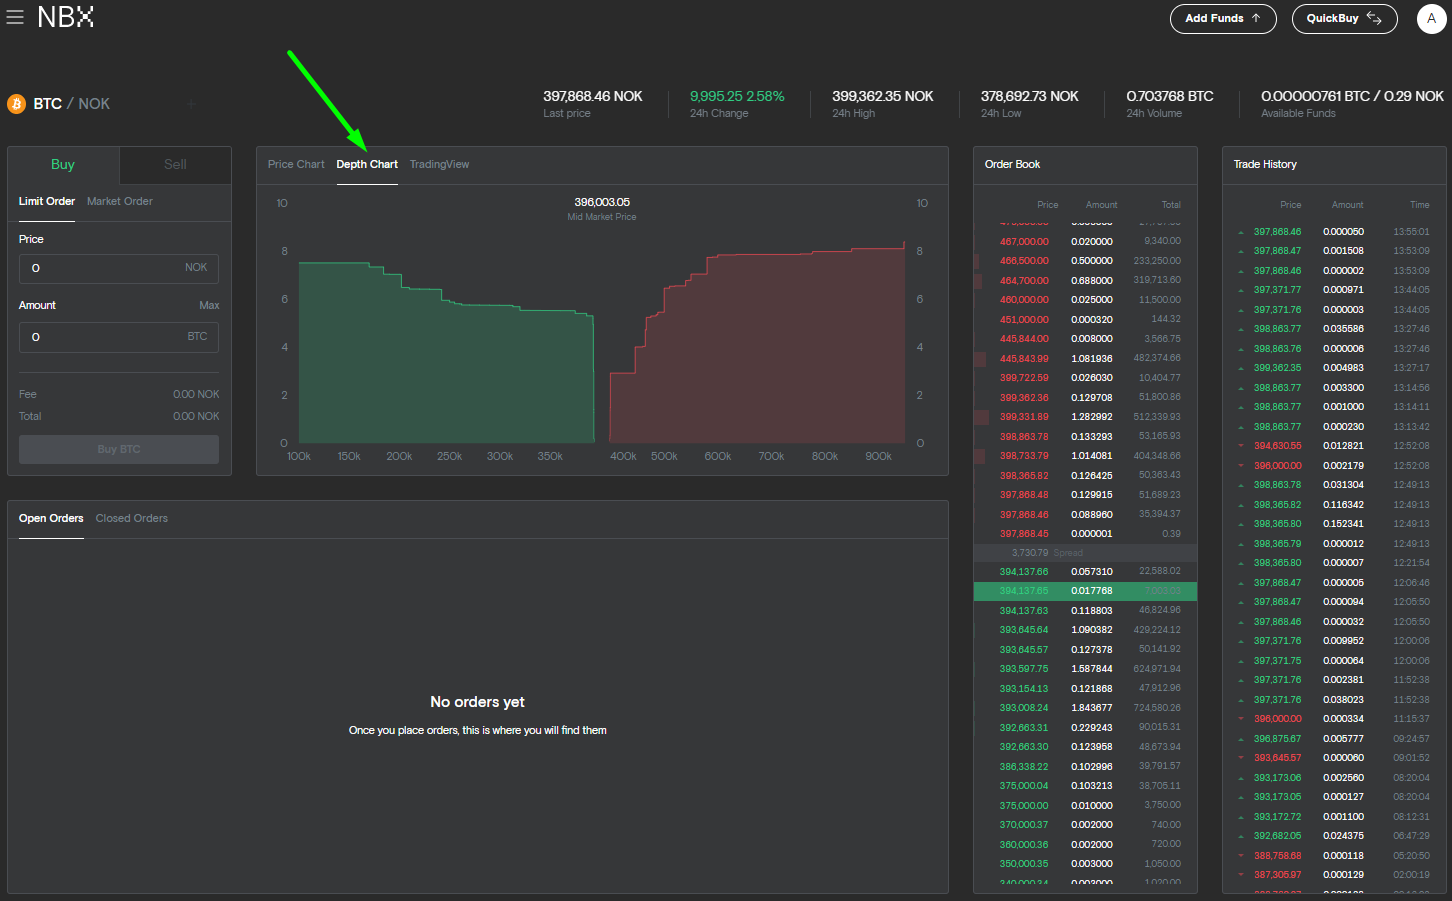
Using the Depth Chart, you can see the movement of a particular asset in the NBX order book in real-time. With this information, together with the other two tabs, it’s easier to decide at what price you’d like to buy or sell.
The Order Book and Trade History
To the right of the three “charting” tabs, you’ll see two tabs labeled “Order Book” and “Trade History.” In a nutshell, the former shows you the list of all the buys and sells on the NBX exchange for the asset you’ve chosen to view, including the price each trade was placed out, the amount of the asset that was involved, and the total volume of trades placed at that amount. The latter, by contrast, breaks each trade down by price, amount, and time.
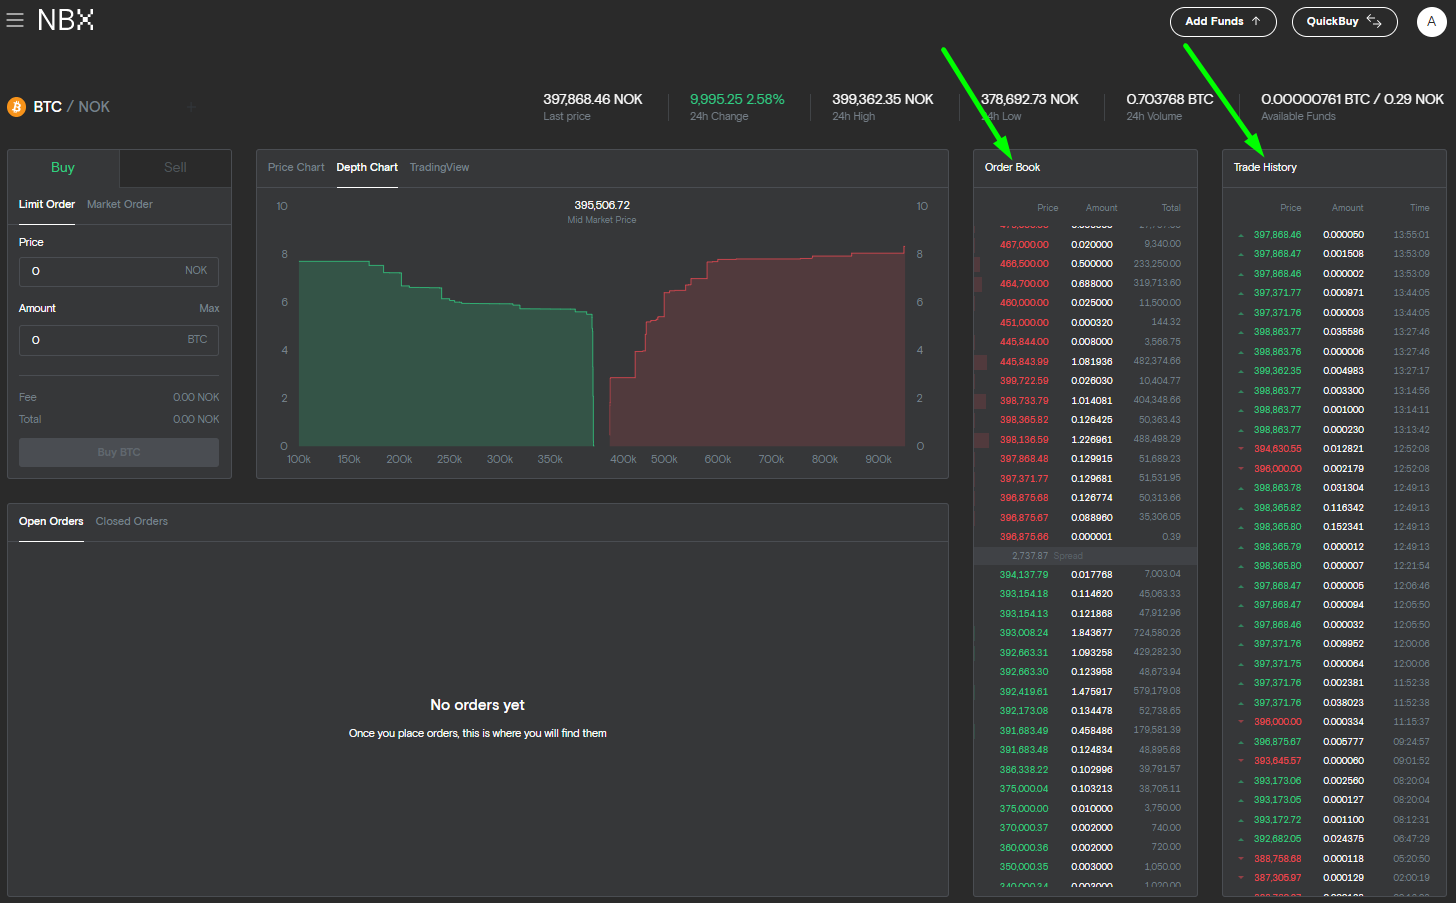
Using both together, you can get the most current window into all of a particular market’s activity.
Open and Closed Orders
On the bottom of your screen, you’ll see two tabs labeled “Open Orders” and “Closed Orders”. The latter will include all of your market and limit orders that have been fully executed, while the former will include all of your trades that are still in progress, for your reference.
With the above information, you can track the movements of all of our supported assets and make more informed decisions related to trading while being certain that you have the most current information at your fingertips.
Read more: